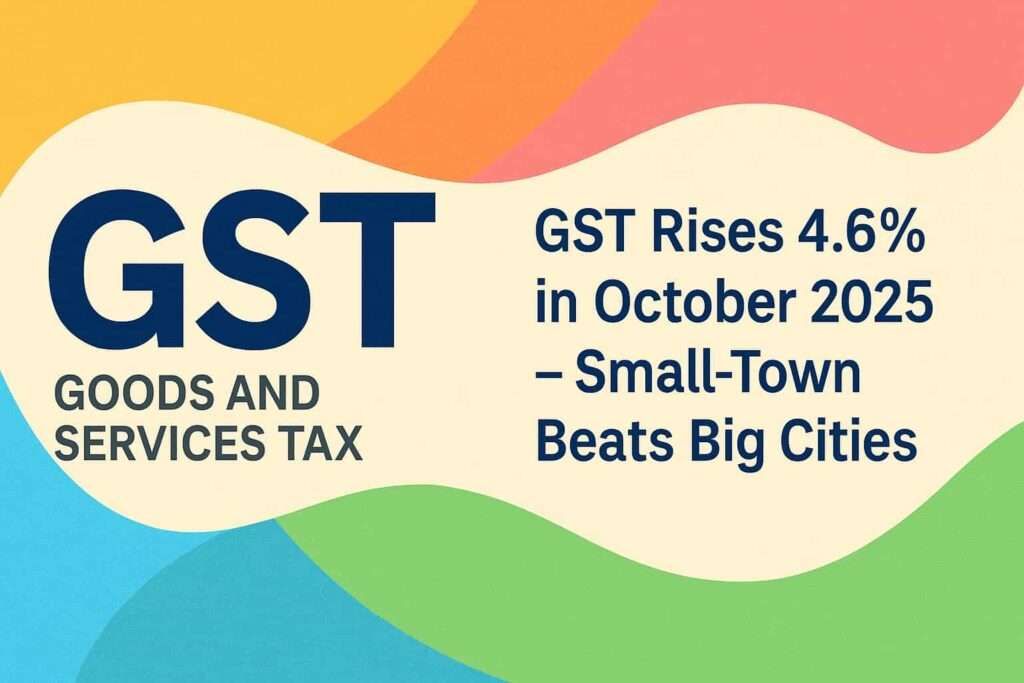
In October 2025, India collected ₹1.96 lakh crore in GST. It shows a 4.6% increase compared to the same month last year, 2024. The net GST revenue was approximately ₹1.69 lakh crore after refunds, which was an increase of just about 0.6%.
While the headline number looks regular, the real story is here — growth is increasingly coming from smaller states and non-metro markets, not just big cities like Delhi or Mumbai.
Why Did GST Grow?
Here’s what boosted this month’s collection:
- Festive purchases from small cities and towns picked up strongly ahead of Diwali.
- Import GST (IGST) jumped by 12.8%, thanks to higher demand for imported electronics, machinery, luxury items, etc.
- GST rate cuts in September on daily-use items encouraged more spending, especially outside metro cities.
- Big cities slowed down — As per the GST revenue collections PDF, early state data shows Delhi’s GST collection slightly dipped compared to last year’s reports, while Maharashtra (including Mumbai) grew at a softer pace.
GST Collection Snapshot – October 2025
| Category | October 2024 (₹ Cr) | October 2025 (₹ Cr) | Growth YoY |
|---|---|---|---|
| Gross GST Collection | 1,87,346 | 1,95,936 | +4.6% |
| Net GST (After Refunds) | 1,68,054 | 1,69,002 | +0.6% |
| Domestic GST Revenue | 1,42,251 | 1,45,052 | +2.0% |
| Import GST (IGST + Cess on Imports) | 45,096 | 50,884 | +12.8% |
What’s Changing? — Small Places, Big Impact
- Double-digit GST growth happen in States such as Arunachal Pradesh, Nagaland, and other regions, like Ladakh.
- Digital billing, UPI, and better GST rules have helped most rural and semi-urban India contribute more.
- Metro-state growth is flatter — Delhi saw a slight fall, and Maharashtra only modest growth.
Top 5 States/UTs – Highest GST Growth (Oct 2025 vs Oct 2024)
| State/UT | Growth (%) |
|---|---|
| Nagaland | +46% |
| Arunachal Pradesh | +44% |
| Lakshadweep | +39% |
| Ladakh | +39% |
| Centre Jurisdiction | +38% |
🔻 Bottom 5 States/UTs – Highest GST Decline (Oct 2025 vs Oct 2024)
| State/UT | Growth (%) |
|---|---|
| Puducherry | -24% |
| Himachal Pradesh | -17% |
| Jharkhand | -15% |
| Uttarakhand | -13% |
| Andhra Pradesh | -9% |
What This Means for the Economy
- Tax revenue remains stable despite rate cuts
- The high deman in Festive, it not just an Delhi-Mumbai story — This time, it came from Surat, Jaipur, Coimbatore, Guwahati, Ranchi, etc.
- Online stores, Businesses, brands, and policymakers need to pay more attention to Tier-2 and Tier-3 now, after the stats.
- Government revenues stay strong ahead of Budget 2026
Sectors That Contributed the Most to GST – October 2025
| Sector | Why GST Went Up |
|---|---|
| Automobile (Cars, Bikes, EVs) | Festive buying + new car launches = more vehicle sales and higher GST. |
| Electronics & Mobile Phones | Big discounts during festive sales pushed up sales of mobiles, TVs, laptops, etc. |
| Retail & Small-Town Stores | This time, data say more GST from local shops and traders than tier 1 cities. |
| Imports (Global Goods Coming In) | Higher imports of electronics, machinery, and luxury goods increased GST on customs. |
| Fashion, Lifestyle & Food Chains | In Festival time, people spend more on clothes, beauty products, restaurants, and cafes |
| Construction & Building Materials | India is a developing country, so cement, steel, and tiles demand consistently high. big projects, real states, and house building day to day. |
Bottom line
In simple, India’s tax engine is no longer powered only by metros. It’s now driven by families, shopkeepers, and businesses in small towns and growing states.
More News –

